


 40 / 80

Marques-Mejías MA, et al.
J Investig Allergol Clin Immunol 2019; Vol. 29(5): 365-370
© 2019 Esmon Publicidad
doi: 10.18176/jiaci.0364
children was pollen (275/596 [46.1%]), followed by animal
dander (136/596 [22.8%]), molds (61/596 [10.2%]), and house
dust mite (39/596 [6.5%]). No sensitization was found at the
time of evaluation in 14.3% of the sample.
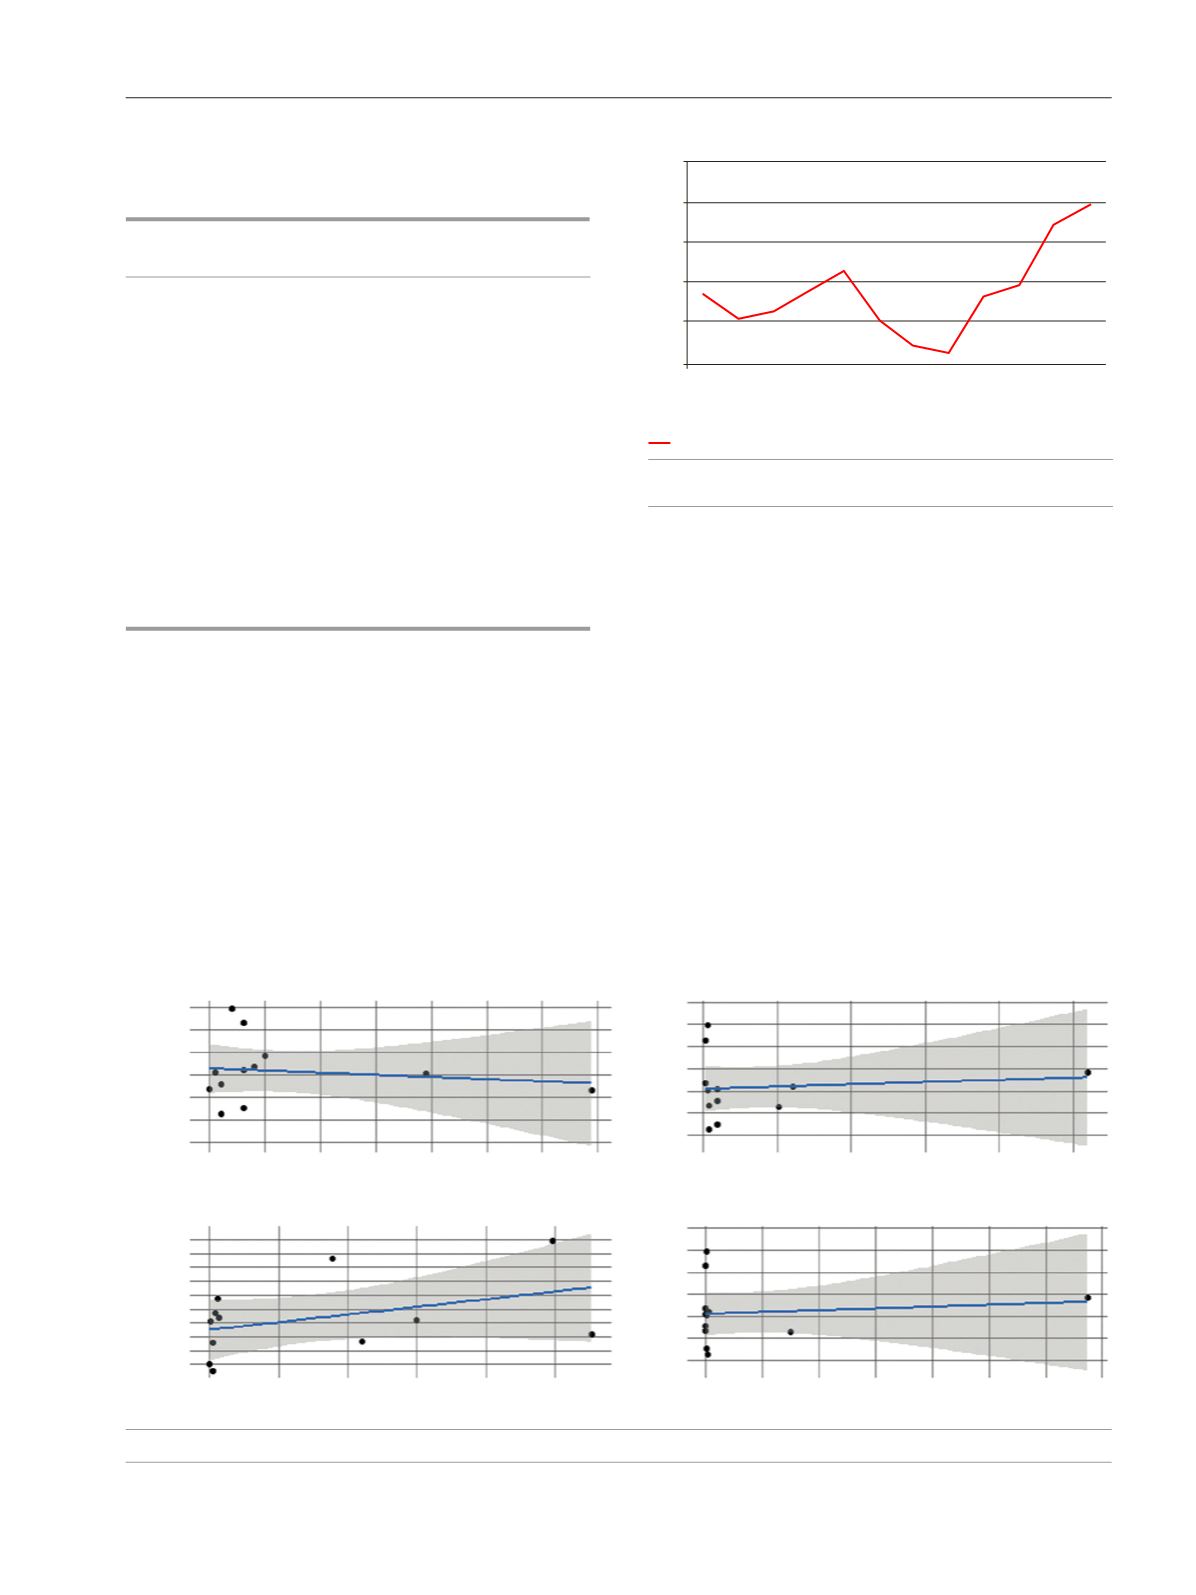
Astatistically significant (
P
<.0001) relationship was found
between grass pollen counts and ED admissions, whereas no
correlation was found between ED admissions and counts of
other pollens (
Cupressus arizonica, Olea europaea
) and molds
(
Alternaria alternata
) (Figure 2).
A positive correlation was found between admission to
the ED and NO
2
0.58 (95%CI, 0.02-0.87) and PM
10
0.751
(95%CI, 0.31-0.93). Assessment of these air pollutants based
on a linear regression model reinforced these findings (Figure
2). Aweak negative correlation was found between ozone and
ED admissions (–0.67 [95%CI, –0.9 to –0.17]) (Figure 3).
We further analyzed the effect of environmental factors
by dividing our sample into 3 groups: (
1
) Children aged 0-3
years, who presented a weak but significant positive correlation
to viruses according to epidemiological data and clinical
characteristics.
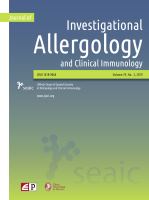
During 2015, the highest number of patients attended for
asthma exacerbations was registered in December, November,
May, and October in descending order (
P
<.0001). The highest
percentage of patients being followed in allergy departments
and attended in the EDwas registered inMay (34.1%) followed
by February (29.2%) and April (28.6%). The difference
between these percentages and those recorded during the rest
of the year was statistically significant (
P
<.0001) (Figure 1).
A total of 596 out of 2609 (22.8%) patients were evaluated
in allergy departments. The most prevalent sensitizer in these
Table.
Number of Recurrent Asthma Exacerbation Episodes in Children
That Attended the Emergency Department at Hospital Universitario La
Paz During 2015
Month
No. of Recurrent
%
Episodes
January
76
10.7
February
50
7.0
March
58
8.1
April
69
9.7
May
88
12.3
June
40
5.6
July
14
2.0
August
9
1.3
September
62
8.7
October
107
15.0
November
86
12.1
December
54
7.6
Number of episodes
Cupressus arizonica
Olea europaea
Alternaria alternata
Gramineae
ED Admissions
ED Admissions
ED Admissions
ED Admissions
0
0
0
0
20
200
200
100
40
400
400
400
200
0
600
400
200
0
500
400
300
200
100
600
400
200
0
600
200
60
January
July
March
September
May
November
February
August
April
October
June
December
625
500
375
250
125
0
Figure 1.
Number of patients with asthma exacerbations who attended
the emergency department during 2015.
Figure 2.
Correlation between pollens (Gramineae,
Cupressus arizonica, Olea europaea
),
Alternaria alternata
, and admissions to the emergency department.
367