


 46 / 80

Cabrera M, et al.
J Investig Allergol Clin Immunol 2019; Vol. 29(5): 371-377
© 2019 Esmon Publicidad
doi: 10.18176/jiaci.0368
skin prick tests. Themean age of patients was 30.95 (range,
16-47) years, and all patients (100%) were sensitized to
grass pollen (with wheals of 4+ [AR >AH: AR=resulting
area in mm
2
: allergen area – saline area]; AH [histamine
area – saline area]) and to Oleaceae, Platanaceae, and
Cupressaceae pollen grains (43.5%, 30.4%, and 56.5%,
respectively, with smaller wheals: 2+ to 3+). Two of the
patients (2009) were sensitized to
Dermatophagoides
pteronyssinus
and 4 (2009) to cat dander, although the
sensitization was not clinically relevant. Nasal symptoms
(sneezing, itching, congestion, and rhinorrhea) were
assessed in patients clinically sensitized to grass pollens in
the previous 2 years.Adaily electronic cardwas completed
on a daily basis with the following scale: 0, absence of
symptoms; 1, mild symptoms; 2, moderate symptoms;
and ≥3, severe symptoms.
– Descriptive statistics of the same variables in 1996
and 2009 and a paired-samples Wilcoxon test (SPSS24
package) for non-normally distributed variables in
order to enable any significant differences to be seen at
the 2 observation points for each of the study variables.
– Categorical principal component analysis (CatPCA,
SPSS24 package) [10] to describe associations between
variables associated with allergy (grass pollen grains
and symptoms). All of the variables were assessed in an
initial analysis, and the most important or representative
associations were established in the final analysis. This
test allowed us to reduce associations between the
variables to 2D and to represent them graphically in
both the periods studied. The variance explained by
this methodology expresses the ability of the analysis
to summarize the relationships between the variables
included.
Results
Total yearly grass pollen counts in 1996 and 2009 were
6588 grains/m
3
and 2556 grains/m
3
, respectively (seasonal
maximum counts: June 1, with 552 grains/m
3
, andMay 11, with
121 grains/m
3
, respectively). The main pollen seasons lasted
fromMay 13 to July 9 and fromMay 2 to July 11, respectively.
The Table includes descriptive statistics for all variables for
both years, highlighting significant differences (
P
=.000) based
on the paired-samples Wilcoxon test, especially for symptoms
(higher score in 2009). The exception was for temperature.
This study is limited by the nonavailability of the trend in
the variables studied over the years, although the temperature
in Madrid has tended to increase over the last 38 years, with
temperature increases of 1.4ºC during May-July from 1979 to
2016 (ie, 0.36ºC per decade) [11].
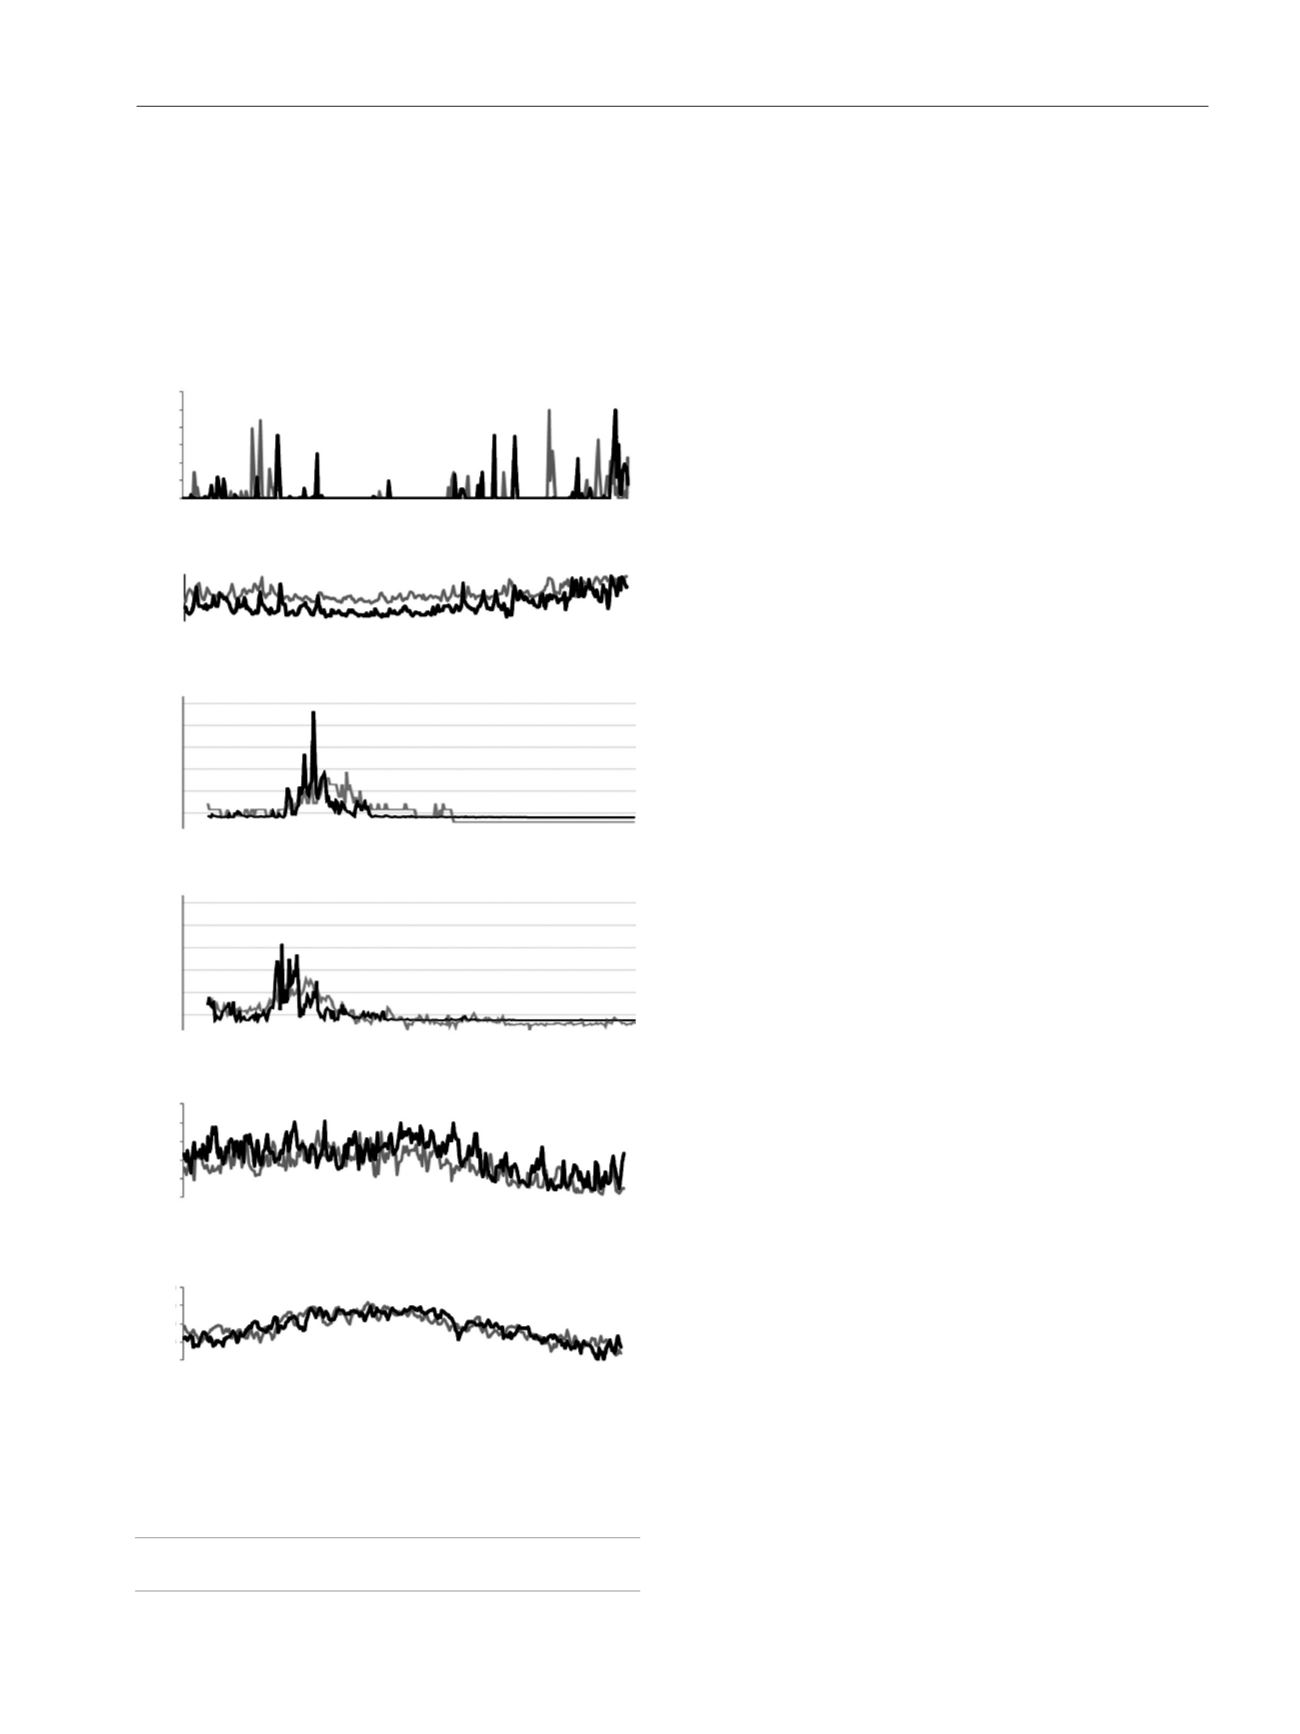
Figure 1 shows plots of the main variables studied during
both time periods; the samples show that increases in grass
pollen grain counts are accompanied by increases in the
symptom score (mean value for 1996, low score; mean value
for 2009, moderate score).
The CatPCA analysis explains around 66.4% of the
variance in 1996 and 70.5% of the variance in 2009. In both
cases, these percentages account for the relationships between
the variables.
– Daily count of rhinitis symptoms in 2 groups of patients
(n=25 in 1996 and n=23 in 2009, after completion of daily
symptom cards at home) selected on the basis of a history
of seasonal allergic rhinitis during the previous 2 years.
Each patient was evaluated based on a medical assessment
that included a clinical history, clinical examination, and
Figure 1.
Plots of the main variables studied during both time periods
23 March to 31 December in 1996 and 2009.
373
a
Daily measurement of all variables.
b
Mean seasonal allergic rhinitis symptoms score recorded by
25 patients in 1996 and 23 patients in 2009.
Rainfall
a
1996
vs 2009, L/m
2
Ozone
a
1996
vs 2009, µg/m
3
Date
Temperature
a
2009 vs
1996
, ºC
23-3
13-7
18-5
7-9
20-4
10-8
15-6
5-10
16-11
6-4
27-7
1-6
21-9
2-11
4-5
24-8
29-6
19-10
30-11
14-12
28-12
Symptom score
a,b
(points) vs grass pollen counts
a
, grains/m
3
1996
Symptom score
a
/++
(points) vs grass pollen counts
a
, grains/m
3
2009
Humidity
1996
vs 2009, %
40.0
30.0
20.0
10.0
0.0
100.00
80.00
60.00
40.00
20.00
0.00
10.00
8.00
6.00
4.00
2.00
.00
10.00
8.00
6.00
4.00
2.00
.00
100.00
50.00
0.00
1.20
1.00
0.80
0.60
0.40
0.20
0.00